
The fastest way to find a hybrid-commute-friendly neighborhood is to score candidate areas on door-to-door commute time, transit reliability, home-office readiness, and daily amenities, then rank them with a weighted template. You can start in the next 15 minutes.
Here is the immediate playbook:
- Open Google Maps and drop a pin at your office. Draw a mental radius for a 30-minute commute (the research-backed manageable threshold) and a 45-minute outer limit. The average American one-way commute is 27.2 minutes as of 2024.
- Pick 3–5 neighborhoods inside that radius that fit your rough budget.
- For each neighborhood, run one simulated commute using Google Maps “Depart at” set to your typical in-office arrival time on a Tuesday or Wednesday.
- Note door-to-door time, transit options, and last-mile walking distance.
- Score each neighborhood on a 1–5 scale across commute time, transit reliability, walkability, home-office space, and cost. The highest total wins your shortlist.
That five-step test takes under 20 minutes and filters out neighborhoods that look good on a Saturday but punish you every Tuesday.
Table of Contents
- What does a hybrid commute calculator actually measure?
- How do you score neighborhoods for hybrid work?
- Which tools give you the most reliable neighborhood data?
- How do you compare neighborhoods step by step?
- What neighborhood archetypes do hybrid workers actually choose?
- What does the timeline and cost look like from shortlist to move-in?
- How does Ficustree speed up a hybrid-commute neighborhood search?
- How do childcare and school locations affect your commute math?
- When should you recalculate your commute score?
- Key Takeaways
- The mistake most buyers make with hybrid commute planning
- Ficustree helps you find the right neighborhood faster
- Useful sources
- FAQ
What does a hybrid commute calculator actually measure?
A commute calculator, in the hybrid-work context, is not just a distance tool. It captures door-to-door travel time, the mix of modes you use (car, train, bike, walk), the variability across departure times, and the cost of each trip. For a daily commuter, a single average time is enough. For a hybrid worker in 2026, you need to know what Tuesday at 8:30 AM looks like versus Thursday at 10:00 AM, because those two trips can differ by 20 minutes on the same route.
Why does this matter more now? Team-dependent hybrid schedules are the most common format, with a significant share of hybrid workers following a schedule set by their team rather than a fixed personal policy. That means your in-office days are not always predictable, and your commute scoring needs to account for peak-time variability, not just an average.
Two thresholds from transport research are worth anchoring to. A one-way commute under about half an hour is generally manageable for most workers. At 45 minutes one-way, stress and wellbeing costs increase noticeably. The average American one-way commute is 27.2 minutes as of 2024, which means most buyers are already near the edge of what feels comfortable.
Employer benefits shift these thresholds. Subsidized transit passes, gas stipends, and quality workplace food materially increase willingness to commute. If your employer covers a monthly transit pass or offers a parking subsidy, a 40-minute commute on two days per week may feel entirely different from the same commute five days a week with no support.
Pro Tip: Always include last-mile time in your simulation. The walk from the train station to your office door, or from your car to your desk, adds 5–12 minutes that Google Maps sometimes underestimates. Add it manually.
Census Bureau ACS data provides useful baseline commute times by metro area, which helps you calibrate whether a neighborhood’s typical commute is above or below the regional norm before you run your own test.
How do you score neighborhoods for hybrid work?
The scoring template below gives you a reproducible way to compare any 3–5 neighborhoods on the dimensions that actually matter for hybrid commuters. Adjust the weights to match your priorities, but keep the structure.
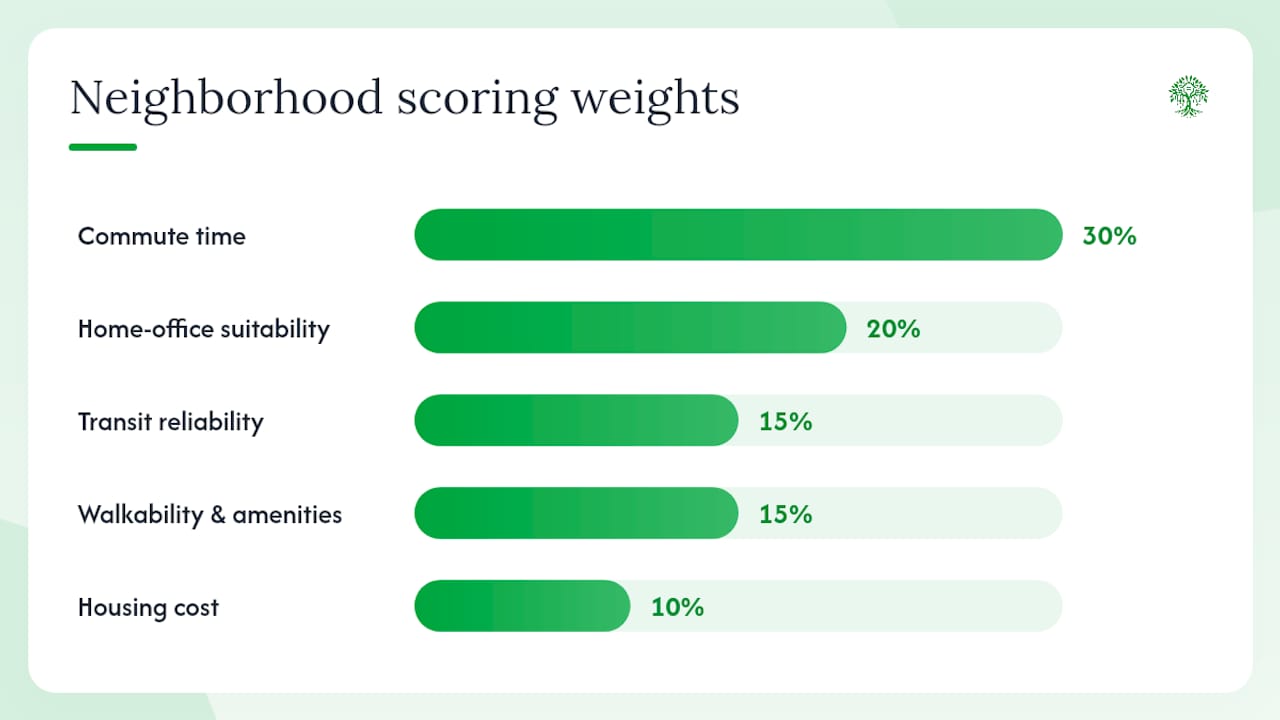
Recommended weights (adjustable):
| Dimension | Weight |
|---|---|
| Door-to-door commute time | 30% |
| Home-office suitability (space, noise, internet) | 20% |
| Transit reliability and options | 15% |
| Walkability and daily amenities | 15% |
| Housing cost and resale demand | 10% |
| Ongoing commute costs (parking, gas, transit pass) | 10% |
Scoring checklist (run this for each neighborhood):
- Commute time — Simulate door-to-door at peak time using Google Maps “Depart at.” Score 5 for under 25 minutes, 4 for 25–35, 3 for 35–45, 2 for 45–55, 1 for over 55.
- Walkability. Use Walk Score to rate grocery stores, pharmacies, coffee shops, and parks within walking distance. A higher Walk Score indicates that most errands can be handled on foot.
- Ongoing commute costs. Estimate monthly parking, gas, or transit pass costs. Add these to your weekly commute budget alongside your mortgage estimate.
Multiply each score (1–5) by its weight and sum the results. The neighborhood with the highest weighted total leads your shortlist.
Which tools give you the most reliable neighborhood data?
Each tool below answers a specific question. Using them together closes the gaps that any single source leaves open.
| Tool | What it measures | Update frequency | Key limitation |
|---|---|---|---|
| Google Maps “Depart at” | Door-to-door travel time by mode at a specific departure time | Real-time / historical traffic | Does not capture transit delays or crowding |
| Transit agency schedules | Scheduled frequency, route coverage, and service hours | Varies by agency (often weekly) | Scheduled vs. actual arrival can differ significantly |
| Walk Score | Walkability, transit score, and bike score by address | Periodic (not real-time) | Does not reflect recent business closures or openings |
| FCC Broadband Map | ISP availability and advertised speeds by address | Updated periodically | Advertised speeds often exceed actual delivered speeds |
| Census ACS (American Community Survey) | Median commute times and commute-mode share by metro and tract | Annual (1-year and 5-year estimates) | Lags current conditions by 1–2 years |
| Local transit agency real-time feeds | Live arrival data and service alerts | Real-time | Requires knowing which app or feed your agency uses |
Simulate your commute at peak time using Google Maps first, then cross-check with the transit agency’s own app. Rider forums on Reddit or Nextdoor often surface reliability issues that neither source shows, such as a bus line that runs on schedule but is consistently overcrowded during rush hour.
For broadband, the FCC map is the right starting point, but call the ISP directly to confirm fiber availability at a specific address before you make an offer. Advertised coverage and actual serviceability at a given address sometimes diverge.
How do you compare neighborhoods step by step?
This method works for any 3–5 candidate neighborhoods. Run it once and you have a defensible shortlist.
- Gather raw data. For each neighborhood, record: peak-time door-to-door commute (Google Maps), transit score (Walk Score), broadband availability (FCC map), median home price (your agent or Ficustree’s map search), and estimated monthly commute cost.
- Validate with a live test. Drive or transit the route on a weekday morning before you make any offer. No simulation replaces the actual experience of standing on a platform at 8:15 AM.
Worked example — two neighborhoods:
Neighborhood A is 28 minutes door-to-door by train (score: 4), Walk Score 82 (score: 5), fiber internet available (score: 5), median price at your ceiling (score: 3), monthly transit cost $120 (score: 4). Weighted total: (4×0.30) + (5×0.15) + (5×0.20) + (3×0.10) + (4×0.10) = 1.20 + 0.75 + 1.00 + 0.30 + 0.40 = 3.65.
Neighborhood B is 38 minutes by car (score: 3), Walk Score 55 (score: 3), cable internet only (score: 3), median price 15% below your ceiling (score: 5), monthly parking $200 (score: 2). Weighted total: (3×0.30) + (3×0.15) + (3×0.20) + (5×0.10) + (2×0.10) = 0.90 + 0.45 + 0.60 + 0.50 + 0.20 = 2.65.
Neighborhood A wins on this weighting, even though Neighborhood B is cheaper. If you go into the office only twice a week, the commute-time weight matters less, and Neighborhood B’s lower price may close the gap. Adjust the weights to your actual in-office frequency and rerun.
What neighborhood archetypes do hybrid workers actually choose?
Most neighborhoods fall into one of four patterns. Recognizing the pattern early saves you from touring homes that will never fit your work life.
Transit-first urban pocket. High Walk Score (75+), rail or rapid bus within a 10-minute walk, dense amenities, smaller home footprints. Commute is fast and predictable. The downside: home-office space is tight, and noise from street or neighbors can disrupt video calls. Best for workers who go in three or more days per week and can carve out a quiet corner.
Car-first outer suburb. Larger homes with dedicated office rooms, quiet streets, good broadband. Commute is 35–50 minutes by car, with meaningful cost and variability at peak times. Best for workers going in one or two days per week who prioritize WFH quality over commute speed.
Mixed-mode inner ring. Moderate Walk Score (55–70), access to both rail and highway, mid-size homes with room for a dedicated office. Commute is 25–40 minutes depending on mode. This archetype suits the most common hybrid schedule: two to three in-office days per week with flexibility to bike or drive depending on weather.
Walkable small-city core. Lower cost than a major urban pocket, genuine walkability for daily errands, often underserved by transit but close enough to the office for a bike commute. Best for buyers whose office is in a mid-size city and who want the lifestyle benefits of walkability without the price premium of a major metro.
Employer-benefit-dependent suburb. A neighborhood that only works if your employer provides a transit subsidy or shuttle. Employer perks like transit passes and gas stipends can make a 40-minute commute financially and psychologically manageable. If those benefits disappear, the math changes fast.
What does the timeline and cost look like from shortlist to move-in?
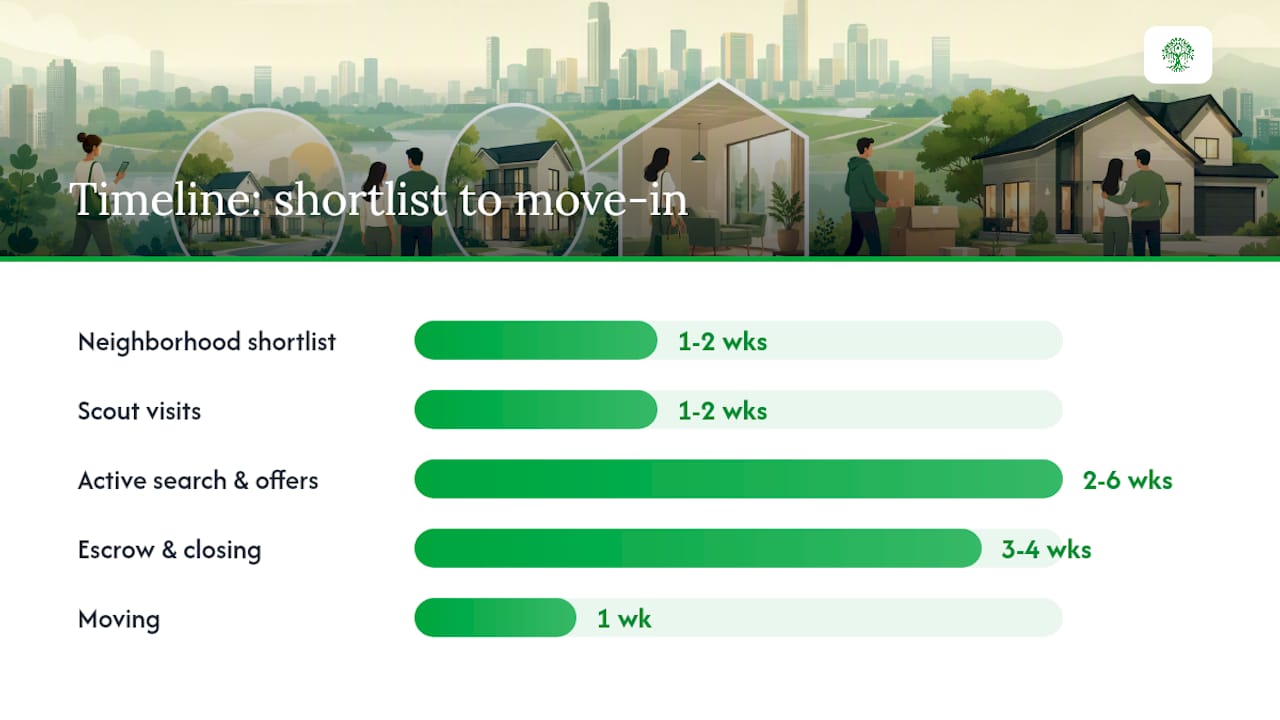
For a first-time buyer using a data-driven platform, the realistic timeline from neighborhood shortlist to move-in runs 8–12 weeks in most California and Texas markets, though competitive markets can compress or extend that window.
| Phase | Typical duration | Key cost |
|---|---|---|
| Neighborhood shortlist and research | 1–2 weeks | $0 (tools are free) |
| Scout visits and live commute tests | 1–2 weeks | Gas, transit fares, time |
| Pre-approval confirmation | 3–5 business days | Credit pull (minor) |
| Active home search and offers | 2–6 weeks | Inspection deposit ($500) |
| Escrow and closing | 3–4 weeks | Closing costs (2–5% of purchase price) |
| Moving | 1 week | $1,500 depending on distance and volume |
Ongoing monthly commute costs vary widely. A transit commuter in a California metro might spend $150–$200 per month on a monthly pass. A car commuter driving 35 miles round-trip two days per week adds roughly $80–$120 per month in gas and wear, plus parking if the office does not provide it free.
Build a weekly commute budget alongside your mortgage estimate. A neighborhood that saves $300 per month on housing but adds $250 per month in commute costs is not the deal it appears to be. Use Ficustree’s home affordability calculator to run the full PITI plus commute scenario before you commit to a search area.
Seasonality affects both timeline and commute quality. Spring markets in California move fast, often with multiple offers within days of listing. Texas markets vary more by city. Winter commutes in northern metros add weather variability that your summer simulation will not capture.
How does Ficustree speed up a hybrid-commute neighborhood search?
Most buyers spend weeks manually pulling data from five different tools, then lose track of which neighborhood scored what. Ficustree compresses that process by layering commute overlays, neighborhood scoring, and affordability analysis into a single platform built specifically for first-time buyers.
The platform’s AI-assisted search surfaces homes that match your commute radius, budget, and home-office criteria simultaneously, rather than making you filter for each separately. Ficustree’s decision intelligence approach means the system explains why a neighborhood fits your criteria, not just that it does, which helps buyers who are comparing trade-offs across multiple areas make faster, more confident decisions.
On representation: Ficustree represents buyers directly at $1,000 at closing plus 1% commission. The premium platform and all buyer tools are free. Where legally permitted, buyers keep a rebate of roughly 2%. Showing agents are available on demand by the hour, so you can schedule live commute-test visits without committing to a full-service agent relationship before you are ready.
For buyers in California and Texas who are working through the neighborhood scoring method in this article, Ficustree’s tools handle the data-gathering steps automatically, leaving you to focus on the judgment calls: which trade-offs matter most to your work life and your family.
How do childcare and school locations affect your commute math?
A neighborhood that scores well on office commute can still fail the daily logistics test if your child’s school or daycare is in the opposite direction. This is one of the most common blind spots in hybrid-work home searches.
The practical fix is to add a second commute simulation: school drop-off to office, not just home to office. If the school is on the way, the combined trip may add only 5–10 minutes. If it requires a detour, that detour happens every in-office day, and it compounds fast over a school year.
Commuter house-hunting checklists consistently flag school proximity as a scoring dimension alongside transit access and walkability. The reason is practical: childcare and school schedules are often less flexible than office schedules, so a missed drop-off window can cascade into a late arrival at work.
When scoring neighborhoods, add a ninth dimension to your template: school or childcare proximity and route efficiency. Score it on the same 1–5 scale. A neighborhood where the school is a five-minute walk scores 5; one where drop-off requires a 20-minute detour in the opposite direction from the office scores 1 or 2.
Also check after-school care availability in each neighborhood. Hybrid schedules sometimes mean a parent is home by 3:30 PM on WFH days but not on office days. Neighborhoods with strong after-school program infrastructure reduce the logistics burden on office days.
When should you recalculate your commute score?
Your hybrid schedule is not static. Employer policies, team structures, and personal circumstances change, and your neighborhood scoring should reflect those changes before they become a problem.
Recalculate whenever one of these triggers occurs:
- Your in-office frequency changes by one or more days per week. Going from two days to three days in-office shifts the commute-time weight significantly and can change which neighborhood wins.
- Your employer changes its transit benefit or parking policy. A lost transit subsidy can add $150–$200 per month to your commute cost, which changes the affordability math on your current home.
- Your team moves to a different office location. Even a 10-minute shift in office location can change which neighborhoods sit inside your 30-minute radius.
- A new transit line opens or a service cut reduces frequency on your route. Transit agencies in major metros update schedules periodically, and a route that ran every 10 minutes may drop to every 20.
Hybrid work schedules are team-dependent for roughly 40% of hybrid workers, which means policy changes at the team level, not just the company level, can shift your commute parameters. Build a calendar reminder to re-run your neighborhood score every six months, or immediately after any employer policy change.
If you are still in the home search phase, ask your employer directly about schedule stability before you commit to a neighborhood. A written policy or a manager’s clear statement about expected in-office frequency is worth more than an assumption when you are signing a 30-year mortgage.
Key Takeaways
The most reliable way to find a hybrid-commute-friendly neighborhood is to score candidates on door-to-door commute time, home-office suitability, transit reliability, and daily amenities using a weighted template, then validate with a live weekday test before making an offer.
| Point | Details |
|---|---|
| Use the 30/45-minute rule | Target under 30 minutes one-way for frequent in-office days; 45 minutes is the stress threshold. |
| Weight home-office suitability at 20% | Space, noise, and broadband quality matter as much as commute speed on WFH days. |
| Factor in-office frequency into your weights | Two days per week changes the math significantly compared to four; adjust scores accordingly. |
| Add a weekly commute budget | Calculate monthly commute costs alongside mortgage estimates to avoid false affordability. |
| Ficustree accelerates the shortlist | Ficustree’s AI platform layers commute overlays and neighborhood scoring for first-time buyers in California and Texas, compressing weeks of manual research. |
The mistake most buyers make with hybrid commute planning
Most buyers visit neighborhoods on a Saturday afternoon and call it research. That is the single biggest error in hybrid-commute home searches, and it produces a distorted picture almost every time. Saturday traffic bears no resemblance to Tuesday at 8:20 AM. A neighborhood that feels calm and accessible on a weekend can be a bottleneck on a weekday morning, with a bus that runs every 25 minutes instead of every 8.
The second mistake is treating the home-office as an afterthought. Buyers spend hours comparing commute times to the minute, then tour homes where the only quiet space is a closet. On a three-day WFH week, you spend more waking hours in your home office than you do commuting. Broadband reliability and a room with a door are not luxuries; they are productivity infrastructure.
The third mistake is ignoring employer benefit changes. A transit subsidy that makes a 40-minute commute affordable can disappear with a policy update. Buyers who anchor their neighborhood choice to a benefit they do not control are one policy memo away from a commute that no longer works financially.
The correction for all three is the same: run your analysis on weekday data, weight home-office quality seriously, and build your neighborhood score on the commute you will actually pay for, not the one your employer currently subsidizes. Consulting a local agent, such as those at Attain RE, can also surface neighborhood-level intel that no dataset captures, like which streets flood in winter or which blocks have the most turnover.
Ficustree helps you find the right neighborhood faster
Searching for a hybrid-commute-friendly home across five neighborhoods, three data sources, and a spreadsheet you built yourself is a slow way to make one of the largest financial decisions of your life. Ficustree gives you a faster path.

The platform combines AI-powered neighborhood scoring, commute overlays, and affordability analysis in one place, built specifically for first-time buyers in California and Texas. You get direct buyer representation at $1,000 at closing plus 1% commission, a free premium platform, on-demand showing agents, and a rebate of roughly 2% where legally permitted. No retainer, no lock-in, no six-month search spiral.
The Ficustree buyer platform walks you from a scored neighborhood shortlist to a signed offer with decision intelligence at every step. Start your neighborhood search now at ficustree.ai.
Useful sources
A note on these resources: each source below answers a specific question in the research process. Use them in the order that matches where you are in your search.
- [[How Much Time Should You Spend Commuting to Work — The Wall Street Times]](https://wallstreettimes.com/how-much-time-commuting-to-work/)
- Commute to Work: How to Make It Worth It for Your Employees | Fooda
- How to Choose the Right Neighborhood Before You Move: The Complete Research Guide for 2026
- Ultimate Urban House-Hunting Checklist for Commuters
- Lifestyle-First Home Search Strategy Guide
- Three Types of Hybrid Work Schedules with Pros and Cons
- ficustree
- Home – AI-Powered Real Estate Search
- AI Home Search for Buyers: What Changes Now
FAQ
Is a 30-minute commute reasonable for hybrid workers?
Yes. Research treats 30 minutes one-way as the practical target for manageable commuting, with 45 minutes marking the threshold where stress and wellbeing costs increase noticeably. For hybrid workers commuting two to three days per week, a 35-minute commute is often acceptable.
What is the most popular hybrid work schedule in 2026?
Team-dependent hybrid schedules are the most common format, with a significant share of hybrid workers following a schedule set by their team. Fixed personal schedules (such as Monday/Wednesday in-office) are less common but easier to plan a commute around.
How do I find the best home locations for hybrid work?
Score candidate neighborhoods on door-to-door commute time, transit reliability, home-office suitability (space, noise, broadband), walkability, and housing cost using a weighted template. Validate your top two choices with a live weekday morning commute test before making an offer.
What is the best way to balance commuting and working from home?
Weight your neighborhood search toward home-office quality on WFH days and commute predictability on in-office days, rather than optimizing for one or the other. A weekly commute budget, calculated alongside your mortgage estimate, helps you see the true cost of each neighborhood trade-off.
How does Ficustree help with hybrid-commute home searches?
Ficustree’s AI platform layers commute overlays, neighborhood scoring, and affordability analysis for first-time buyers in California and Texas, compressing weeks of manual research into a guided shortlist. Buyers pay $1,000 at closing plus 1% commission and use the full platform free.
Recommended
- Home – AI-Powered Real Estate Search
- Home – AI-Powered Real Estate Search
- AI Home Search for Buyers: What Changes Now
- Buying a Home in California: Browse 467 Cities

Leave a Reply