
Rising cost-of-living index scores shrink your real purchasing power, which pushes you toward cheaper substitutes, delayed big-ticket purchases, and tighter budgets, whether you notice the shift or not. By the second quarter of 2026, 62% of U.S. consumers increased grocery spending. That is not belt-tightening out of habit. It is a direct, measurable response to a number most people only glance at in a news headline.
Here’s what that number actually forces you to decide:
- Whether to trade down to store brands or hold the line on quality
- Whether now is the moment to buy a car, a home, or wait another year
- Whether your paycheck still covers the same standard of living it did last year
- Whether the city you’re house hunting in is quietly pricing you out
For anyone shopping for a home, this math gets personal fast. A tool like Ficustree’s affordability calculator turns an abstract index score into a concrete monthly payment, which is where the real decision-making happens.
Key Takeaways
Your real purchasing power drops when the cost-of-living index rises faster than your income, and the fix is calculating your own weighted inflation rate rather than trusting the national CPI headline.
| Point | Details |
|---|---|
| COLI measures place, not time | A cost-of-living index compares your area’s costs to a 100-point national baseline, unlike CPI, which tracks price change over time. |
| Housing drives most of the swing | Housing carries the heaviest weight in most COLI composites, so location choice affects affordability more than any other factor. |
| Spending shifts to essentials first | Consumers cut dining and entertainment before groceries, a pattern confirmed by the 2026 EY-Parthenon survey. |
| Personal inflation beats headline CPI | Weighting your own 4 to 6 spending categories gives a far more accurate picture than a national average. |
| Ficustree turns index data into real numbers | Ficustree’s affordability calculator converts regional cost differences into an actual monthly PITI figure for first-time buyers. |
Table of Contents
- Why Cost-of-Living Index Movements Change Your Buying Decisions
- How Cost-of-Living Numbers Get Built, and Where They Mislead You
- How Rising Living Costs Actually Change What You Buy
- Turning Index Numbers Into Budget, Salary, and Timing Decisions
- Calculating Your Own Personal Inflation Rate
- What Housing-Heavy Cost-of-Living Data Means for First-Time Buyers
- The Psychology Behind Cutting Back When Costs Rise
- How Inflation and the Cost-of-Living Index Work Together Against Your Wallet
- Real Households, Real Adjustments: What This Looks Like in Practice
- What the Data Actually Tells You to Do Differently
- Get a Real Affordability Number Before You Search, Not After
- Sources
- FAQ
Why Cost-of-Living Index Movements Change Your Buying Decisions
A cost-of-living index, or COLI, measures how much it costs to maintain a given standard of living in one place compared to another, using 100 as the national baseline. Score 115 and you’re looking at a metro that runs 15% above average; score 92 and you’re in a market that stretches your paycheck further. This is different from the Consumer Price Index, or CPI, which tracks how prices for a fixed basket of goods change over time in one location rather than comparing places against each other.
The distinction matters more than most people realize. CPI tells you whether milk cost more this March than last March. COLI tells you whether living in Austin costs more than living in Sacramento right now. Bankrate’s breakdown of the concept is a good plain-English starting point if you want the full mechanics.
Four categories drive most COLI scores, and they carry very different weights:
- Housing — rent or mortgage costs, which typically dominate the index and swing scores the most
- Groceries — the cost of a standard food basket, adjusted regionally
- Transportation — gas prices, insurance, and public transit costs
- Healthcare — regional variation in medical and insurance pricing
Housing’s outsized weight is the detail most people miss. Two cities can have nearly identical grocery and transportation costs and still land 20 or 30 points apart on the overall index, purely because one has dramatically higher rent. That is why a “high cost-of-living city” almost always means a high housing-cost city first and everything else second.
How Cost-of-Living Numbers Get Built, and Where They Mislead You
The Bureau of Labor Statistics collects monthly price quotes across hundreds of CPI subcategories, from bread to dental visits, and those figures ripple into everything from Social Security cost-of-living adjustments to interest rate decisions. Regional cost-of-living comparisons, by contrast, typically follow the C2ER Cost of Living Index methodology, which surveys local prices across dozens of metro areas and weights housing heaviest in the composite score.
That housing weight is also the index’s biggest vulnerability. A small sampling error in local rent data or an unrepresentative apartment sample can swing a whole metro’s score by several points, since housing carries so much influence in the final number.
Statistic Callout: A metro area scoring even a few points higher on housing alone can shift its entire composite index enough to change whether a household qualifies as “affordable” or “expensive” by national standards, according to the C2ER manual.
Common pitfalls worth watching for:
- Free online calculators that don’t disclose their data sources or sample size
- Comparisons built on outdated baskets that don’t reflect current rent or grocery prices
- Indexes that blend metro-wide averages, hiding neighborhood-level swings within the same city
- Confusing CPI trend data (how fast prices are rising) with COLI level data (how expensive a place is right now)
CPI and COLI can diverge sharply. National CPI might show mild 3% annual inflation while a specific metro’s COLI jumps because local rents spiked independently of the national trend. Know which number you’re actually looking at before you make a decision based on it.
How Rising Living Costs Actually Change What You Buy
The data on this is remarkably consistent: when the cost-of-living index climbs, households don’t cut spending evenly. They reallocate it, often within weeks. The EY-Parthenon consumer sentiment survey found 62% of consumers increased grocery spending in the second quarter of 2026 while 27% pulled back on restaurants and entertainment, a textbook trade-down pattern.
Here’s how that shows up in real shopping carts and calendars:
- Trading down to private label. Shoppers swap name brands for store brands on staples first, since the quality gap on basics like pasta or paper towels is smallest.
- Cutting discretionary categories before touching essentials. Streaming subscriptions and dining out get trimmed long before grocery or utility budgets do.
- Delaying big-ticket purchases. Cars, appliances, and home renovations get pushed back a quarter or a year when the index climbs faster than income.
- Shifting brand loyalty. Consumers who’ve never comparison-shopped start doing it, and retailers that offer loyalty pricing or bulk discounts pick up share.
- Timing purchases around sales cycles more deliberately. Instead of buying when they need something, cost-conscious shoppers wait for the predictable markdown window.
The first, a family of four, delays replacing their aging minivan for another year and instead handles the extra maintenance costs, because a car payment on top of higher grocery and rent bills doesn’t pencil out. The second, a single professional, doesn’t touch major purchases at all but switches from a name-brand grocery run to a discount grocer and cancels two subscription services. Same index movement, two completely different household responses, based on what’s flexible in each budget.
This is also where big purchases like homes diverge sharply from smaller ones. A car purchase decision might get delayed a few months. A home purchase decision often gets delayed a few years, or redirected entirely toward a different, more affordable metro area, because the dollar amounts at stake are so much larger relative to income.

Pro Tip: Before you assume you need to cut a category entirely, check whether the price increase is temporary (like a seasonal grocery spike) or structural (like a rent increase that resets your whole budget baseline). Structural increases deserve a permanent budget line change; temporary ones don’t.
Turning Index Numbers Into Budget, Salary, and Timing Decisions
Reading a cost-of-living index is only useful if it changes what you do next. Here’s a practical sequence for putting the number to work.
- Look up your metro’s current COLI score against the national baseline of 100, using a source that discloses its methodology rather than a black-box calculator.
- Compare that score to your last salary negotiation or lease renewal. If your area’s index rose 6% and your income rose 2%, you’ve lost real ground even though your paycheck grew.
- Anchor a raise request to local data, not gut feeling. A simple script: “Cost of living in this metro has risen roughly [X]% based on regional CPI data since my last review, and I’d like to discuss adjusting my compensation to reflect that.” Numbers make the conversation concrete instead of emotional.
- Decide whether a big purchase should move earlier or later. If financing rates are tied to inflation trends and expected to climb further, locking in sooner can save money. If your local index is driven by a temporary spike, waiting it out often makes more sense.
- Adjust your savings targets, not just your spending. A higher regional cost of living usually means a higher down payment target and a bigger emergency fund, since your baseline monthly costs have moved up too.
Statistic Callout: Between 2020 and 2023, the Congressional Budget Office found prices for typical consumption bundles rose an average of 4.5% annually for middle-income households, cutting purchasing power by roughly $3,000 a year. That’s not a rounding error. That’s a car payment or a meaningful chunk of a down payment fund, gone before you even noticed.
The mistake most people make here is applying a national inflation number to a very local decision. Your personal experience of rising costs depends heavily on what you actually spend money on, which is exactly what the next section fixes.
Calculating Your Own Personal Inflation Rate
National CPI numbers are averages across millions of households buying wildly different things. A renter in a hot rental market and a homeowner with a fixed-rate mortgage experience completely different inflation, even in the same city. A quick personal inflation calculation fixes that mismatch, and it only takes five steps.
- List your 4 to 6 biggest spending categories. Typically: housing, groceries, transportation, healthcare, and one discretionary category like dining or entertainment.
- Assign each category a share of your total spending. If housing eats 35% of your budget, that’s its weight.
- Find the price change for each category using regional CPI subcategory data where available.
- Multiply each category’s weight by its price change, then add the results together for your personal inflation rate.
- Compare that number to your income growth over the same period to see if you’re actually gaining or losing ground.
Two quick examples show how differently this plays out:
| Household Type | Biggest Weighted Category | Personal Inflation Driver |
|---|---|---|
| Renter, high rent exposure | Housing at 40% of budget | Rent increases dominate the total, even if groceries stay flat |
| Homeowner, fixed mortgage | Groceries and transportation at 45% combined | Food and gas price swings matter more since housing costs are locked in |
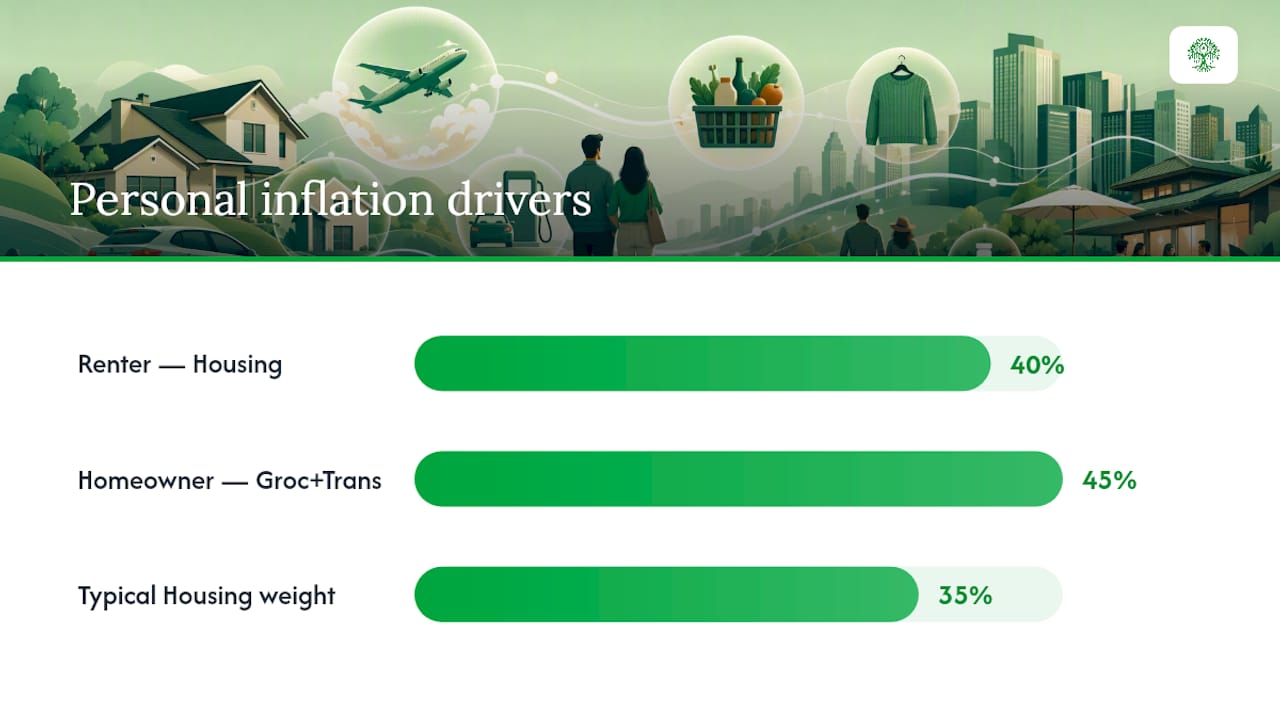
A homeowner with a fixed mortgage barely feels housing inflation at all, but gets hit harder by a spike in grocery or gas prices since those categories carry more relative weight in their budget. Once you know your number, you know whether to pad your emergency fund, delay a purchase, or renegotiate a bill.
What Housing-Heavy Cost-of-Living Data Means for First-Time Buyers
Housing’s outsized weight in every COLI calculation is exactly why your choice of metro area, and even neighborhood, does more to determine home affordability than almost anything else in your control. A buyer comparing two similarly priced homes in different cities isn’t just comparing sticker prices. They’re comparing entire cost structures, since property taxes, insurance rates, and typical HOA fees vary right alongside the index score itself.
That’s the gap Ficustree’s tools are built to close. The Home Affordability Calculator takes regional cost inputs and converts them into a real monthly PITI number, so you’re not guessing how a higher-COLI metro translates into your actual mortgage payment. Pair that with a true cost of homeownership breakdown and you get a picture that goes well beyond the listing price.
- Run your target metro’s numbers before you fall for a listing photo
- Compare neighborhoods, not just cities, since scores can vary block by block
- Treat a high COLI score as a signal to revisit your down payment target, not a reason to panic
Pro Tip: If you’re deciding between two metros with a 10 to 15 point COLI gap, run both through an affordability calculator before you commit to a search area. The gap usually shows up almost entirely in housing costs, not groceries or gas.
Ficustree built its Ultimate Home Affordability Calculator specifically for first-time buyers trying to make sense of numbers like these, since the standard advice to “figure out what you can afford” rarely accounts for regional cost differences that swing affordability by tens of thousands of dollars.
The Psychology Behind Cutting Back When Costs Rise
Rising living costs don’t just shrink your budget. They change how your brain processes every purchase decision, often before you’ve consciously registered that prices have moved.
Loss aversion kicks in first. Once people notice their grocery bill or rent has climbed, they become more sensitive to any additional spending, even in categories unrelated to the original increase. That’s why a rent hike often triggers cuts in dining out, not just housing-related belt-tightening. The brain treats the household budget as one connected system, and a shock anywhere in it makes every purchase feel riskier.
Anchoring plays a role too. Consumers who remember what a grocery cart or a car payment used to cost keep comparing new prices to that old anchor, which makes every purchase feel like a loss even when their income has technically kept pace. This is part of why emotional decision-making trips up first-time buyers specifically, since a home purchase carries more emotional weight and more anchoring bias than almost any other transaction a household makes.
There’s also a scarcity mindset effect: once people start cutting back in one area, they tend to overcorrect and cut more broadly than the actual cost increase justifies, out of a general sense of caution. Recognizing that tendency is often the difference between a rational budget adjustment and an overcorrection that delays a purchase you could actually afford.
How Inflation and the Cost-of-Living Index Work Together Against Your Wallet
Inflation and the cost-of-living index measure related but distinct things, and confusing them leads to bad decisions. Inflation tracks how fast prices are rising over time nationally. The cost-of-living index tracks how expensive a specific place is right now, relative to everywhere else. You can live somewhere with low inflation but a high absolute cost of living, or somewhere with rapid inflation but a still-low baseline cost.
The two interact in a way that compounds pressure on your purchasing power. National inflation raises the price of everything you buy, while your local COLI score determines the baseline you’re inflating from. A 4.5% annual inflation rate, the CBO’s estimate for middle-income households between 2020 and 2023, hits a household in a high-COLI metro much harder in dollar terms than the same percentage hitting a household in a low-COLI metro, because the starting costs were already higher.
This is why BLS inflation data ripples into decisions far beyond the grocery aisle. Interest rates, Social Security cost-of-living adjustments, and even contract escalator clauses in leases and union agreements are tied to inflation figures. When those adjustments lag behind actual local cost increases, which happens often in high-COLI metros, purchasing power erodes even for households receiving regular raises.
For big-ticket purchases specifically, long-term inflation expectations matter more than short-term CPI swings. A buyer deciding whether to purchase a home now or wait should weigh where inflation and interest rates are headed over the next few years, not just this month’s headline number.
Real Households, Real Adjustments: What This Looks Like in Practice
The pattern shows up consistently across income levels, just with different pressure points. A mid-career professional watching their metro’s COLI climb might not change their grocery habits much, but delays a kitchen renovation by a year and redirects that money into a higher emergency fund instead.
A young family renting in a high-cost metro faces a sharper version of the same math. With housing eating close to 40% of their budget, even a modest rent increase forces cuts elsewhere, usually starting with dining out and subscription services, exactly the pattern the EY-Parthenon survey documented at the national level.
First-time home buyers show a distinct version of this adaptation. Rather than cutting spending, many redirect their entire search radius, choosing a lower-COLI suburb or a different metro entirely once they run the numbers and realize their target city’s housing costs have outpaced their savings timeline. Others adjust the type of home they’re searching for, moving from a single-family search to a condo or townhouse to bring the monthly payment back in line with a realistic budget. Tools like neighborhood comparison calculators make that kind of pivot data-driven instead of a guess based on a few open houses.
A useful outside reference for how sharply this varies by geography comes from comparisons like Fremont vs. San Jose cost of living, where two neighboring cities show meaningfully different affordability profiles despite being minutes apart, and broader regional forecasts like expected city-level price growth that help buyers anticipate where costs are headed before they commit to a search area.
What the Data Actually Tells You to Do Differently
Most advice on cost of living stops at “budget more carefully,” which is close to useless. The research points somewhere more specific: your personal inflation rate, not the national CPI, should drive your decisions, because the gap between the two can run several points wide depending on your housing situation alone.
The conventional wisdom also gets the timing question backward. People tend to delay big purchases the moment costs feel tight, when the smarter move is often the opposite: lock in a home purchase or a fixed-rate decision before a high-COLI trend fully compounds, rather than waiting for prices to feel comfortable again. They rarely do, not on their own schedule.
If you take one thing from this, let it be this: run your own numbers before you make a decision based on a headline. A national inflation figure tells you almost nothing about your specific rent, your specific grocery basket, or your specific home search. The tools to calculate the real, personal version of that number already exist. Use them before you cut a budget line or sign a purchase agreement based on a guess.
Get a Real Affordability Number Before You Search, Not After
Cost-of-living data only matters if it changes what you actually do next, and for first-time buyers that means knowing your true monthly number before you fall for a listing. Ficustree replaces guesswork with a direct calculation: input your target metro, and the platform’s affordability tools translate that area’s cost profile into real PITI, HOA, insurance, and maintenance figures, the same components that make cost-of-living data actually usable.

There’s no long-term contract and no premium fee to use the platform itself. If you’re weighing whether your target city fits your real budget, run your numbers through the buyer platform and see the monthly picture before you write an offer.
Sources
- EY-Parthenon Consumer Sentiment Survey shows households adapting to higher living costs while long-term anxiety grows | EY – US
- Congressional Budget Office publication
- Cost of Living Index manual (C2ER)
- How BLS inflation data can affect families’ everyday purchasing decisions | Urban Institute
FAQ
Is it good or bad when CPI goes up?
A rising CPI generally erodes purchasing power, meaning your money buys less than it did before, which is why the CBO found middle-income households lost roughly $3,000 in annual purchasing power between 2020 and 2023. It isn’t automatically “bad” if your income rises faster, but for most households, rising CPI means tighter budgets.
What happens when the Consumer Price Index falls?
A falling CPI, or disinflation, means prices are rising more slowly or dropping, which can ease pressure on household budgets, though a sharp or sustained decline sometimes signals broader economic weakness rather than good news for consumers.
What is a good cost-of-living index score?
A score below 100 means an area costs less than the national average, while anything above 100 means it costs more; whether that’s “good” depends entirely on local wages, since a low-COLI area with even lower pay can leave you worse off than a high-COLI area with strong income.
Is it better to have a low or high CPI?
A low, stable CPI is generally better for consumers because it means prices are predictable and purchasing power holds steady, while a high or rapidly rising CPI erodes what your income can buy, especially for essentials like housing and groceries.
Recommended
- True Cost of Homeownership: A Buyer’s Complete Reality Check
- Buy vs Rent Calculator: Compare the Real Cost
- How Much House Can I Afford in 2026? – ficustree.ai

Leave a Reply